The Boardroom Problem
Imagine the slides go up. The room is full: CMO, CFO, a couple of VPs, someone from the board. The campaign numbers for the new phone launch look good. Click-through rates are up 34%, engagement is climbing, and the retargeting ads show a 6x return on ad spend. Someone says "great work" before the deck is even finished.
Now imagine you are the measurement leader in that room. You built the framework, ran the numbers, and you know that what is on that slide is, at best, incomplete and at worst, actively misleading. The 6x ROAS from retargeting? That is last-click attribution talking. It is giving full credit for the sale to the final ad a customer clicked before purchasing: the retargeting banner they saw after already being reached by a YouTube pre-roll ad, a paid social post, a display ad on a tech review site, two weeks of their own research, Reddit threads, and four visits to the product page. The click was not the cause, but the last witness to a decision that had already been made.
You do not say this yet. You let the room have its moment.
Here is what last-click attribution cannot see: the full architecture of influence that preceded that final click. It cannot see that the YouTube pre-roll built initial awareness, that the paid social ad sparked the first product search, or that display kept the brand present during two weeks of consideration. It assigns zero value to every channel that moved the customer closer to a decision, and hands the entire trophy to whichever ad happened to be standing at the door when they walked in. For a high-consideration purchase like a new phone, where the average path to purchase spans 15 or more touchpoints over several weeks, that is not a measurement shortcut. It is a systematically wrong picture of how marketing actually works, and it leads to systematically wrong budget decisions.
Click rates carry the same problem. A 34% lift in clicks tells you that people responded to something: a creative, an offer, a moment of relevance. It tells you almost nothing about whether those clicks turned into incremental revenue that would not have existed without the campaign. Clicks are activity, not causation. In a boardroom where budget decisions follow the metrics on the screen, the difference matters enormously.
The question isn't whether marketing drove outcomes. It's whether it drove outcomes that wouldn't have happened otherwise.
You leave the meeting with your case unmade. The room was not ready, and you know it. You also know something the slide deck does not show: there is a better way to measure what actually happened, and once you see it, you cannot unsee it. The rest of this piece is that way forward.
Correlation Is Not Causation And It Never Was
Most traditional measurement systems are built on correlation. Last-click attribution, multi-touch attribution, and even many early Marketing Mix Models observe that marketing happened and sales followed, then conclude that one caused the other. This is intuitively appealing and analytically dangerous.
Consider a simple example. You send a promotional email to your highest-value customers: the ones who buy from you regularly, who search for your brand by name, who were probably going to purchase this week regardless. Conversions spike. Your email platform reports a +400% ROAS. How much of that was your email, and how much was the inevitable behavior of a loyal customer base you would have captured anyway?
This is what measurement scientists call the counterfactual problem. To truly know whether your marketing worked, you need to know what would have happened in its absence. You cannot observe a world that did not happen, at least not directly. Paul Holland formalized this framework in his landmark 1986 paper, introducing the potential outcomes model as a rigorous basis for causal inference. Judea Pearl extended this into a comprehensive causal framework in his 2009 book Causality. This is precisely what causal inference is designed to solve.
Multi-Touch Attribution: A Bridge and Its Limits
The industry recognized the limits of last-click attribution and tried to solve it. Multi-touch attribution was the answer: a more sophisticated framework that distributes credit across every touchpoint in the customer journey rather than handing it all to the last click. It was a genuine improvement, but it introduced its own set of problems.
MTA relies on individual-level tracking data, cookies, device IDs, and cross-platform identity resolution, all of which have become increasingly difficult to obtain as privacy regulations tighten and third-party identifiers disappear. More fundamentally, even a perfect MTA model still cannot answer the counterfactual question. It can tell you which touchpoints were present on the path to purchase. It cannot tell you which ones actually caused the purchase.
For that reason, MTA today is most useful for intra-channel optimization -- understanding which creatives or placements perform best within a single channel -- rather than the kind of cross-channel strategic picture that drives real budget decisions. That is the job of MMM, and more importantly, of causal measurement.
What Causal Inference Actually Means
Causal inference is a framework for reasoning about cause and effect in the presence of imperfect information. Rather than simply measuring what happened, it attempts to estimate what would have happened under a different set of conditions. In marketing, this almost always means answering one question: what would sales, signups, or revenue have looked like if we had not run this campaign?
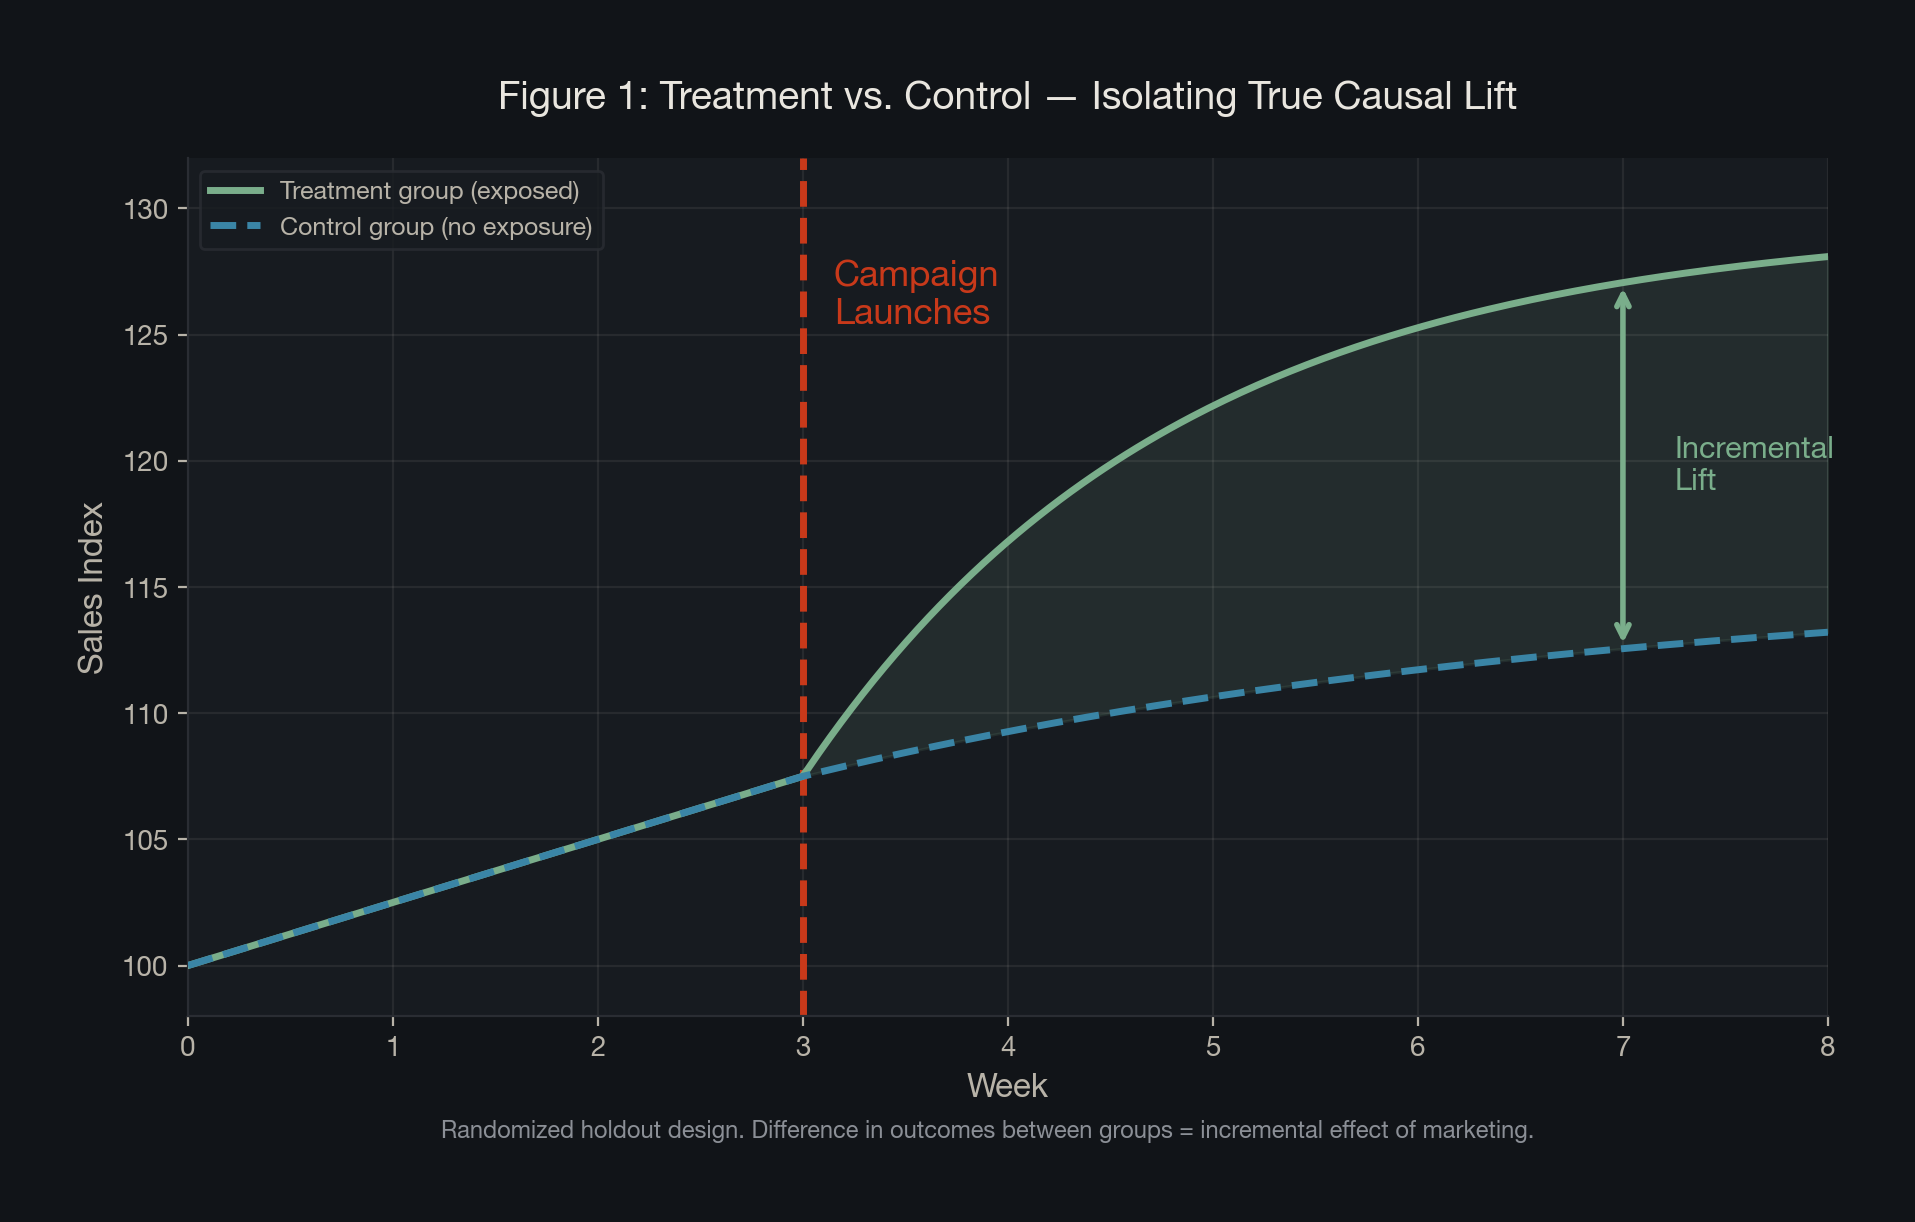
The gold standard for causal inference is the randomized controlled trial, what marketers call an incrementality test or lift study. The logic is identical to a clinical trial. You randomly split your audience into two groups: one exposed to the marketing stimulus (the treatment group) and one that is not (the control group). You hold everything else constant and measure the difference in outcomes. That difference, net of what the control group did on their own, is your true incremental lift.
The formal statistical expression of this is the Average Treatment Effect, the foundation of the potential outcomes framework.
Y(1) = outcome with marketing exposure. Y(0) = counterfactual outcome without it. The difference is the true causal effect.
This is the theoretical target. The lift formula below is how we actually get there in practice.
Treatment group receives marketing exposure; control group does not. The lift ratio captures net new behavior attributable to the marketing activity, stripped of organic demand.
Think back to that boardroom. The 34% click-through rate and the 6x ROAS on the slide are not estimates of this ratio. They do not ask what would have happened without the campaign, nor do they account for the customers who were already going to buy regardless. This formula does. That is precisely why it changes everything about how you read a results deck. This seemingly simple ratio is the difference between knowing your marketing worked and merely hoping it did.
Incrementality is not a campaign metric. It is a strategic lens. It reframes the entire question from "did people convert?" to "did we cause the conversion?"
Bayesian MMM: When You Cannot Always Run a Test
Not every channel, market, or time period can be cleanly tested with a randomized holdout. Running simultaneous experiments across channels risks contamination between test and control groups. Holding back spend for a control group carries real business risk, especially during a high-stakes launch window. Even when experiments are designed well, they are slow. A single well-structured incrementality test can take weeks or months to reach statistical significance. In a world where marketing decisions happen continuously, across dozens of channels and markets at once, you cannot wait for an experiment to tell you what is working. You need an always-on, cross-channel view of performance. That is precisely what Bayesian MMM is built to provide.
Modern Bayesian MMMs encode uncertainty through prior distributions -- beliefs about how marketing works before seeing this year's data -- and update those beliefs with observed evidence to produce a posterior estimate. Those priors can come from previous MMM runs, incrementality experiment results, industry benchmarks, published research, or expert judgment. The result is not just a point estimate but a full probability distribution: a range of likely outcomes with uncertainty quantified rather than hidden.
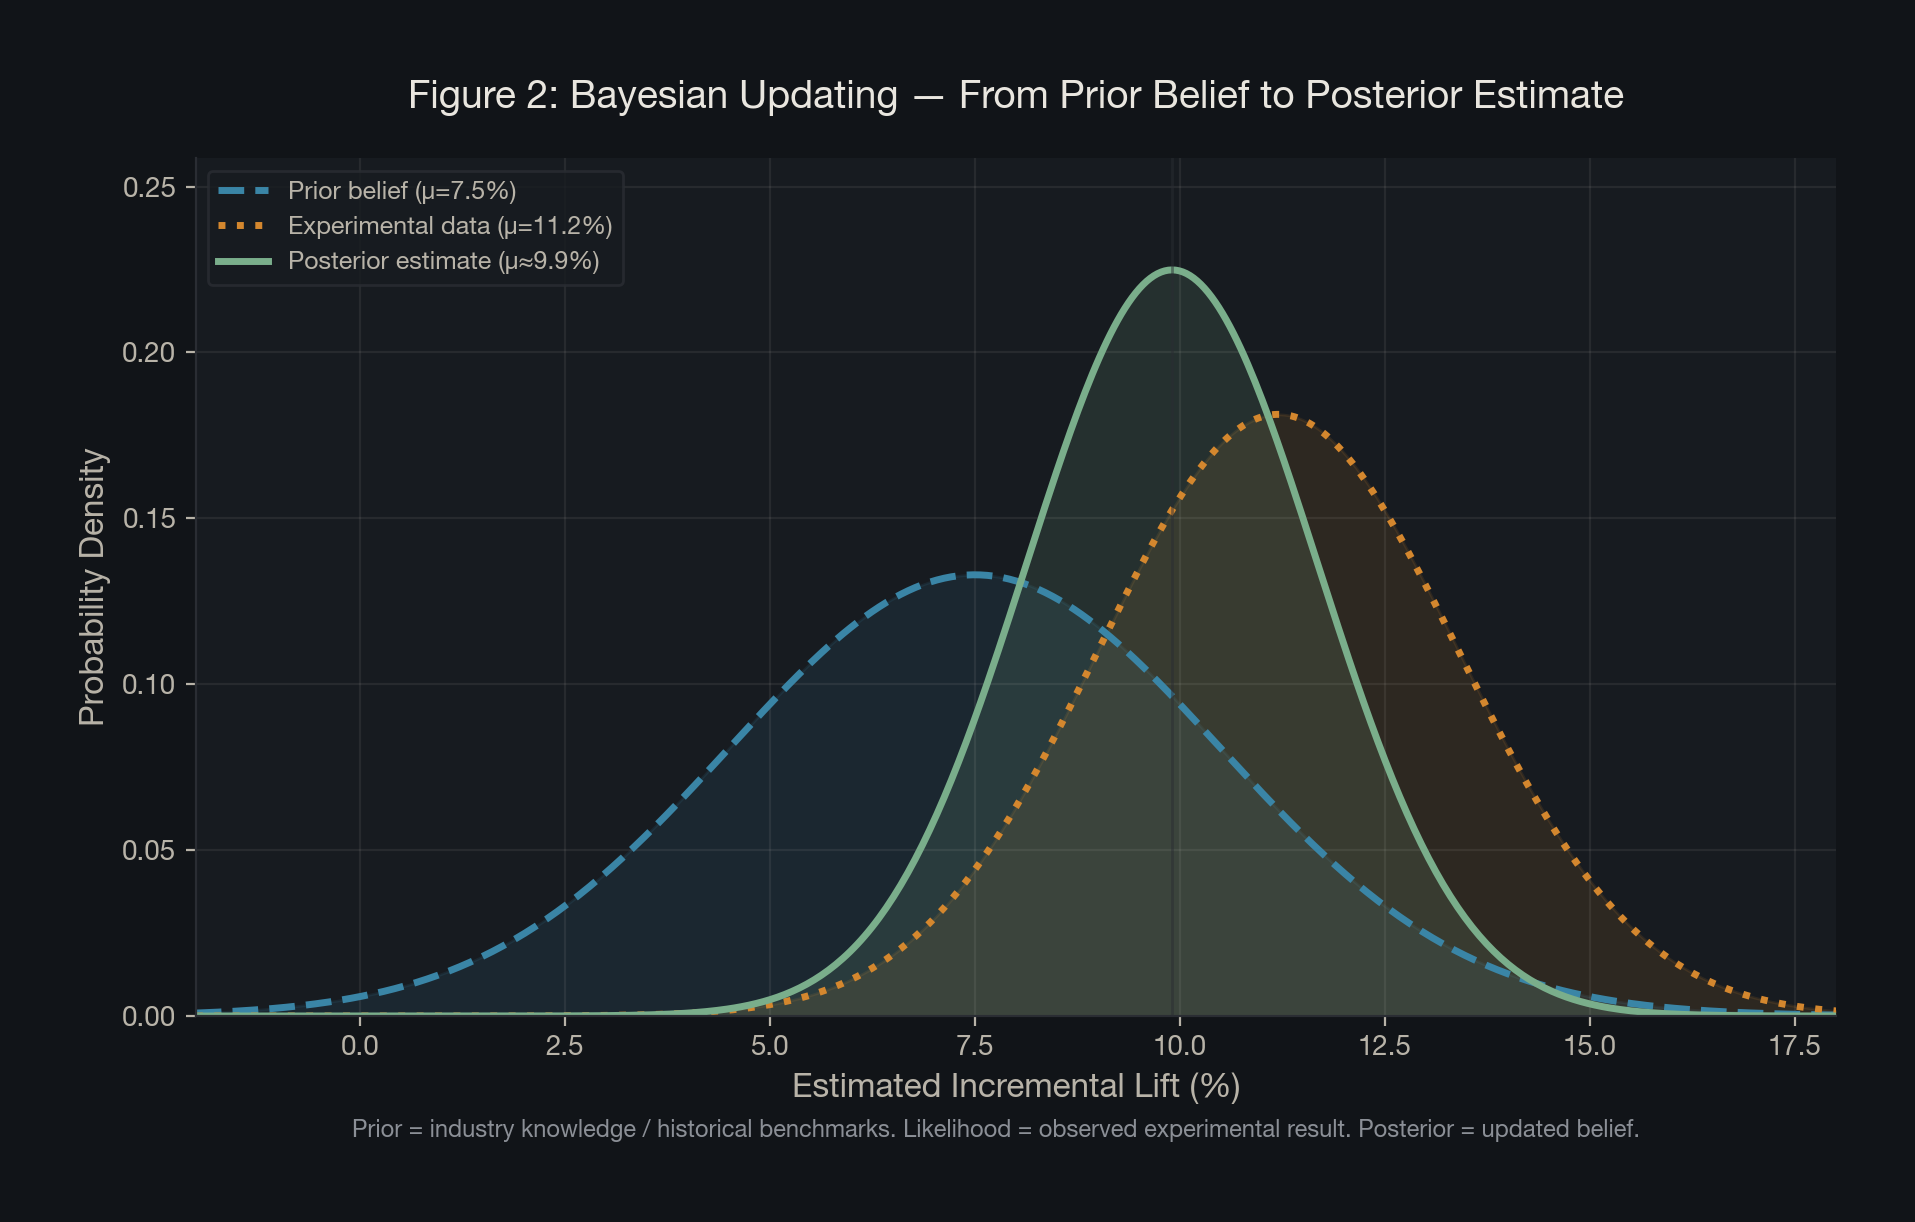
The posterior distribution (updated belief about channel effectiveness) equals the likelihood of the observed data multiplied by the prior distribution (belief before seeing data). This is how the model learns from evidence without starting from scratch.
The practical power of this framework is the prior. If we have run incrementality experiments and know that paid social drives roughly 9 to 12% lift, we can encode that knowledge directly into the model. The MMM then uses observed data to refine that estimate without having to discover it from scratch. When priors are weak or unknown, a wide uninformative prior lets the data do the work instead, which is mathematically equivalent to a frequentist approach.
Several leading frameworks now implement this approach. Google's open source Meridian and PyMC Labs' PyMC-Marketing are fully Bayesian, providing explicit prior distributions and full posterior outputs. Meta's Robyn uses ridge regression at its core, which is mathematically equivalent to a Bayesian model with a Gaussian prior, and supports calibration using incrementality experiments.
The Fool's Gold Problem
The case for causal measurement has never been stronger or more urgent. Three forces are converging to make traditional attribution increasingly unreliable.
First, signal loss. The deprecation of third-party cookies, restrictions on mobile identifiers, and growing privacy regulation have eroded the data infrastructure that multi-touch attribution depended on.
Second, channel complexity. Modern consumers touch more than six channels before converting. The customer journey is non-linear, cross-device, and increasingly cross-platform.
Third, executive scrutiny. Marketing budgets are under more pressure than at any point in recent memory. CFOs are asking harder questions. "Our ROAS looks strong" is no longer a sufficient answer.
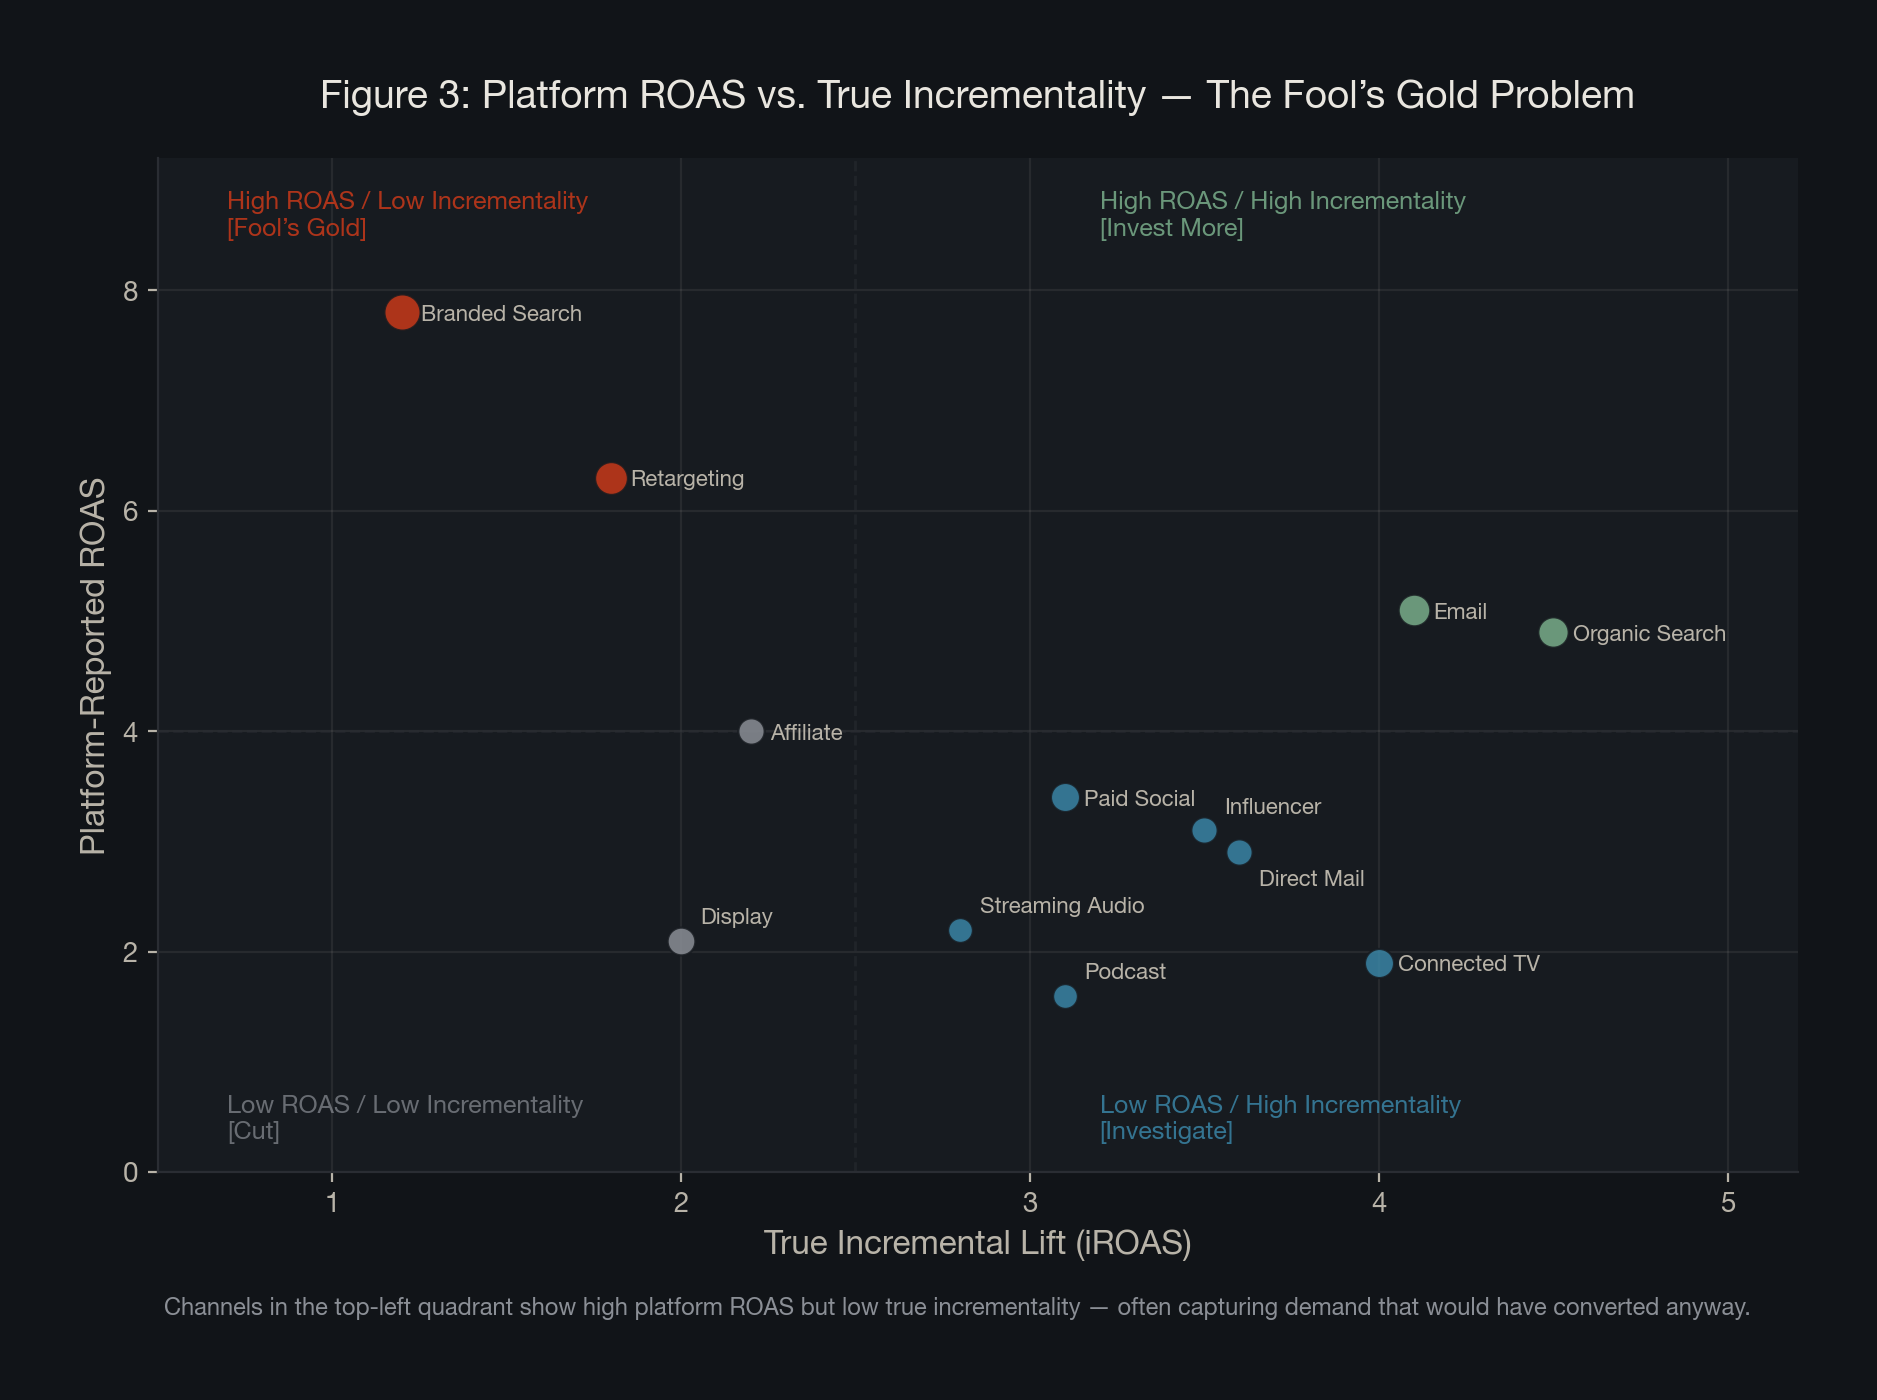
Branded search, retargeting, and email might show some of the highest platform ROAS figures on marketing dashboards, but that doesn't suggest they're more incremental than other channels. A 2025 study by Stella analyzing 225 geo-based incrementality tests found that the gap between platform-reported ROAS and true incremental ROAS commonly reaches 2 to 3x. The reason is selection bias: these channels disproportionately reach people already on a path to convert.
A 2025 study by Stella analyzing 46 Meta incrementality tests across DTC brands found no consistent linear relationship between platform-reported ROAS and true incrementality. A 2024 ANA survey found that 71% of advertisers now consider incrementality the most important KPI for retail media investments.
Platform ROAS tells you who converted near your ads. Incrementality tells you who converted because of them. These are very different questions.
The Causal Measurement Triangle
No single measurement approach is sufficient on its own. The most defensible investment decisions emerge when multiple methods converge across various industries and verticals.
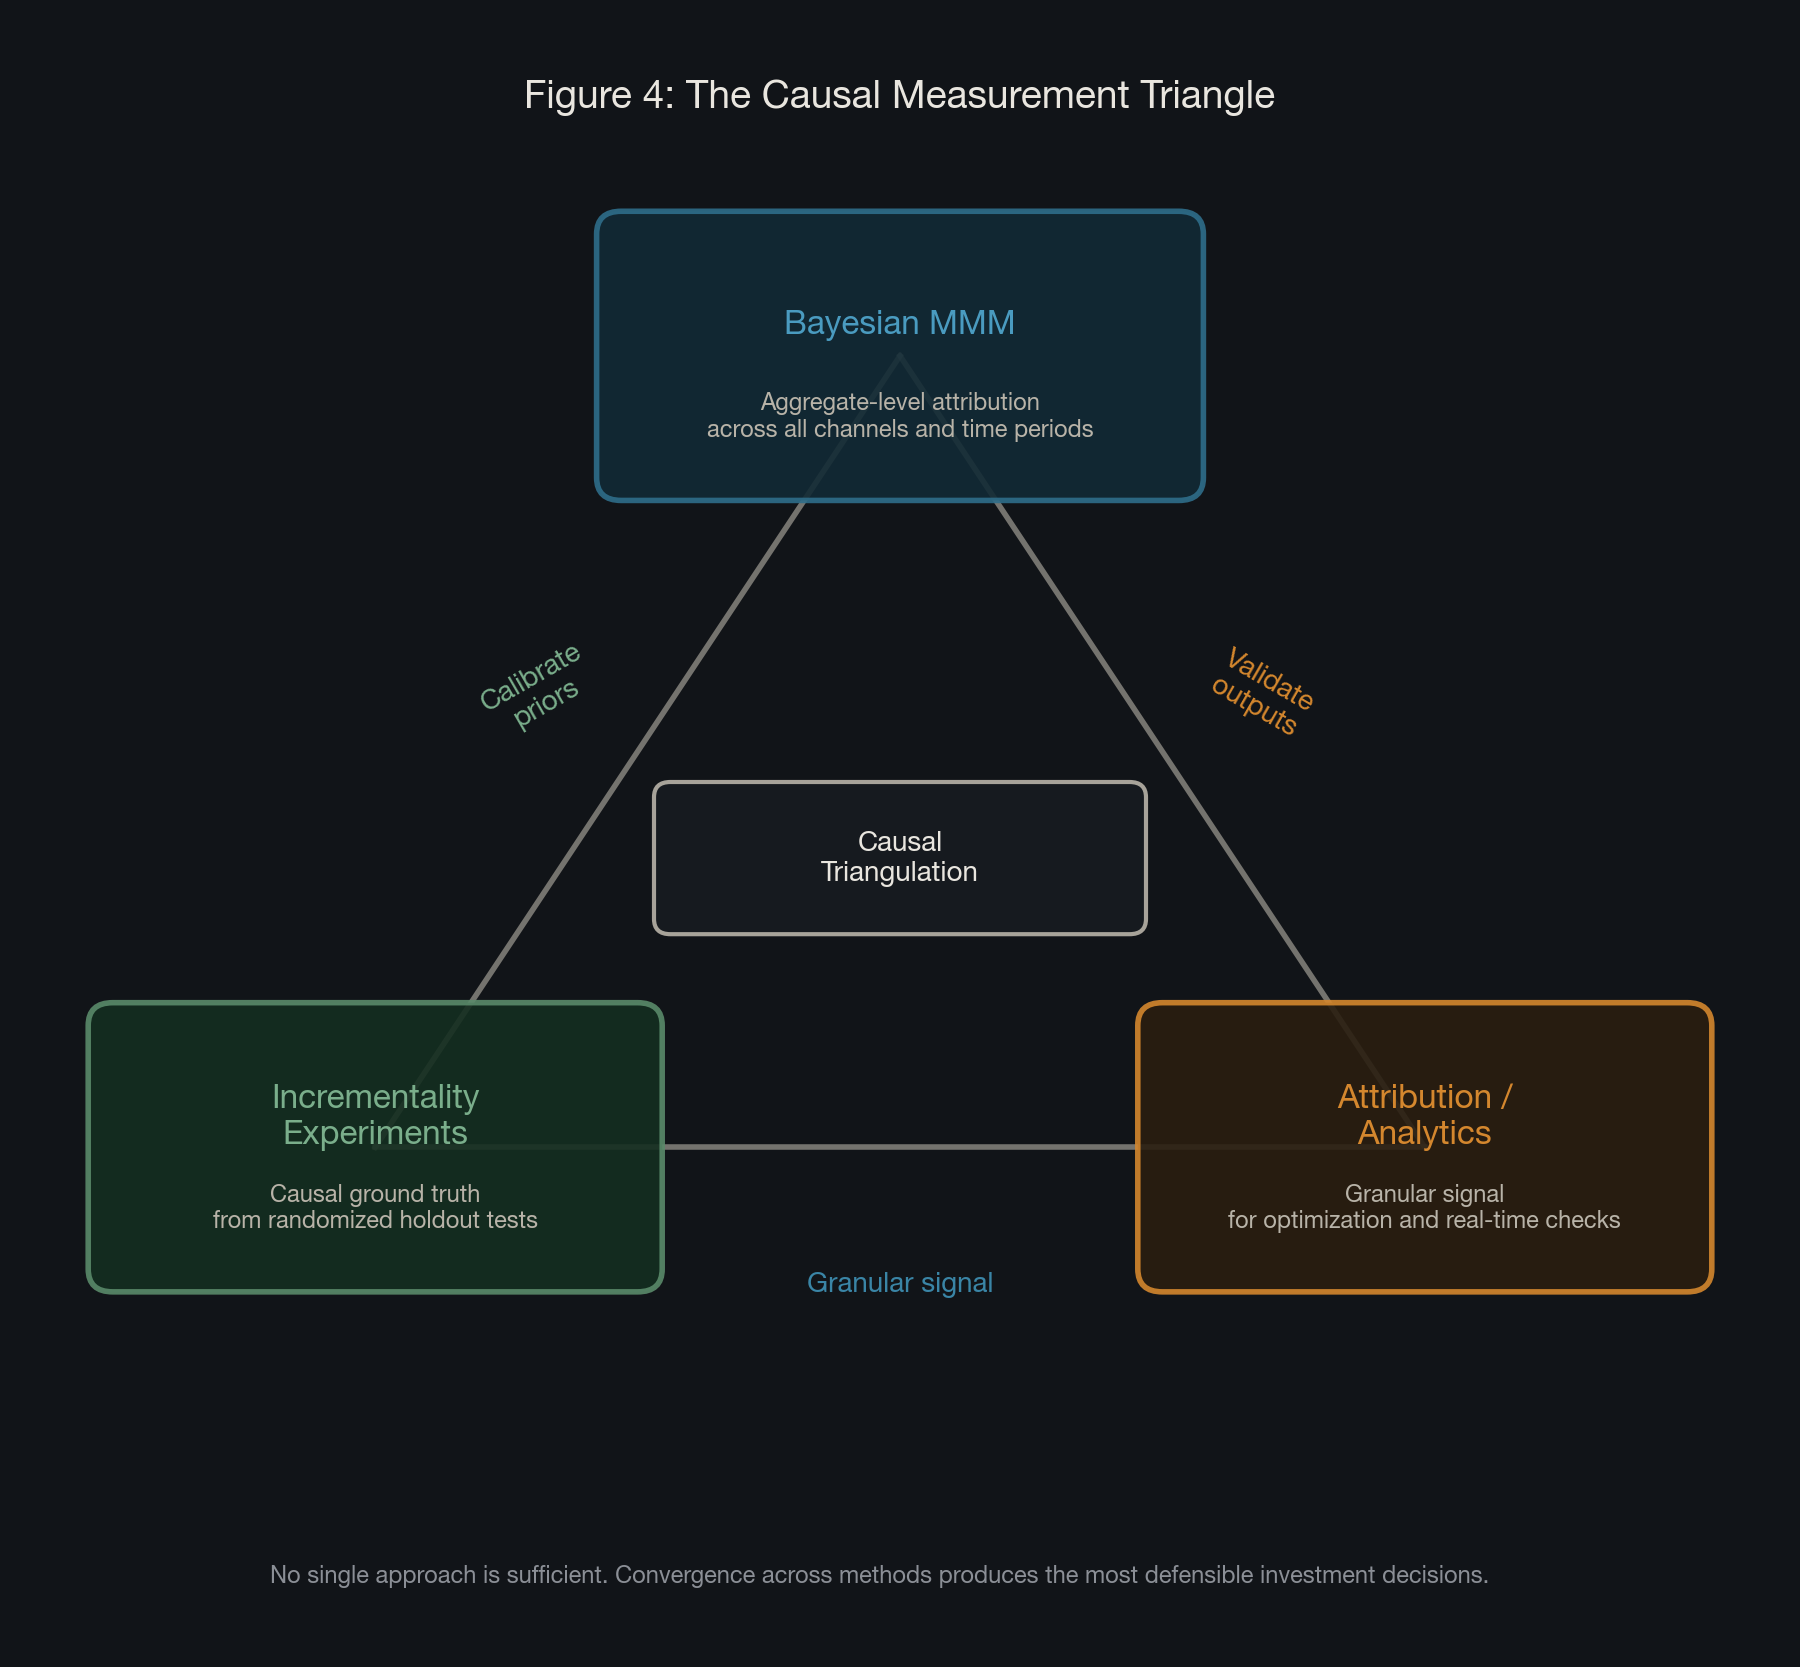
The key is understanding what each method is actually built to do. Bayesian MMM provides the macro view: how each channel contributes to revenue at the aggregate level. Incrementality experiments provide the causal ground truth: clean estimates of what specific campaigns actually caused. Attribution provides the granular signal: user-level data useful for in-channel optimization.
These three are not equal legs of a stool: the MMM is the engine, incrementality experiments calibrate, and attribution informs it at the tactical level.
One of the more nuanced insights in modern measurement is that as a Bayesian MMM matures, particularly when built with hierarchical market-level modeling, the reliance on formal incrementality testing can decrease.
Even with all of this rigor, budget allocation remains part science and part judgment. Three situations illustrate where the measurement leader's judgment is irreplaceable.
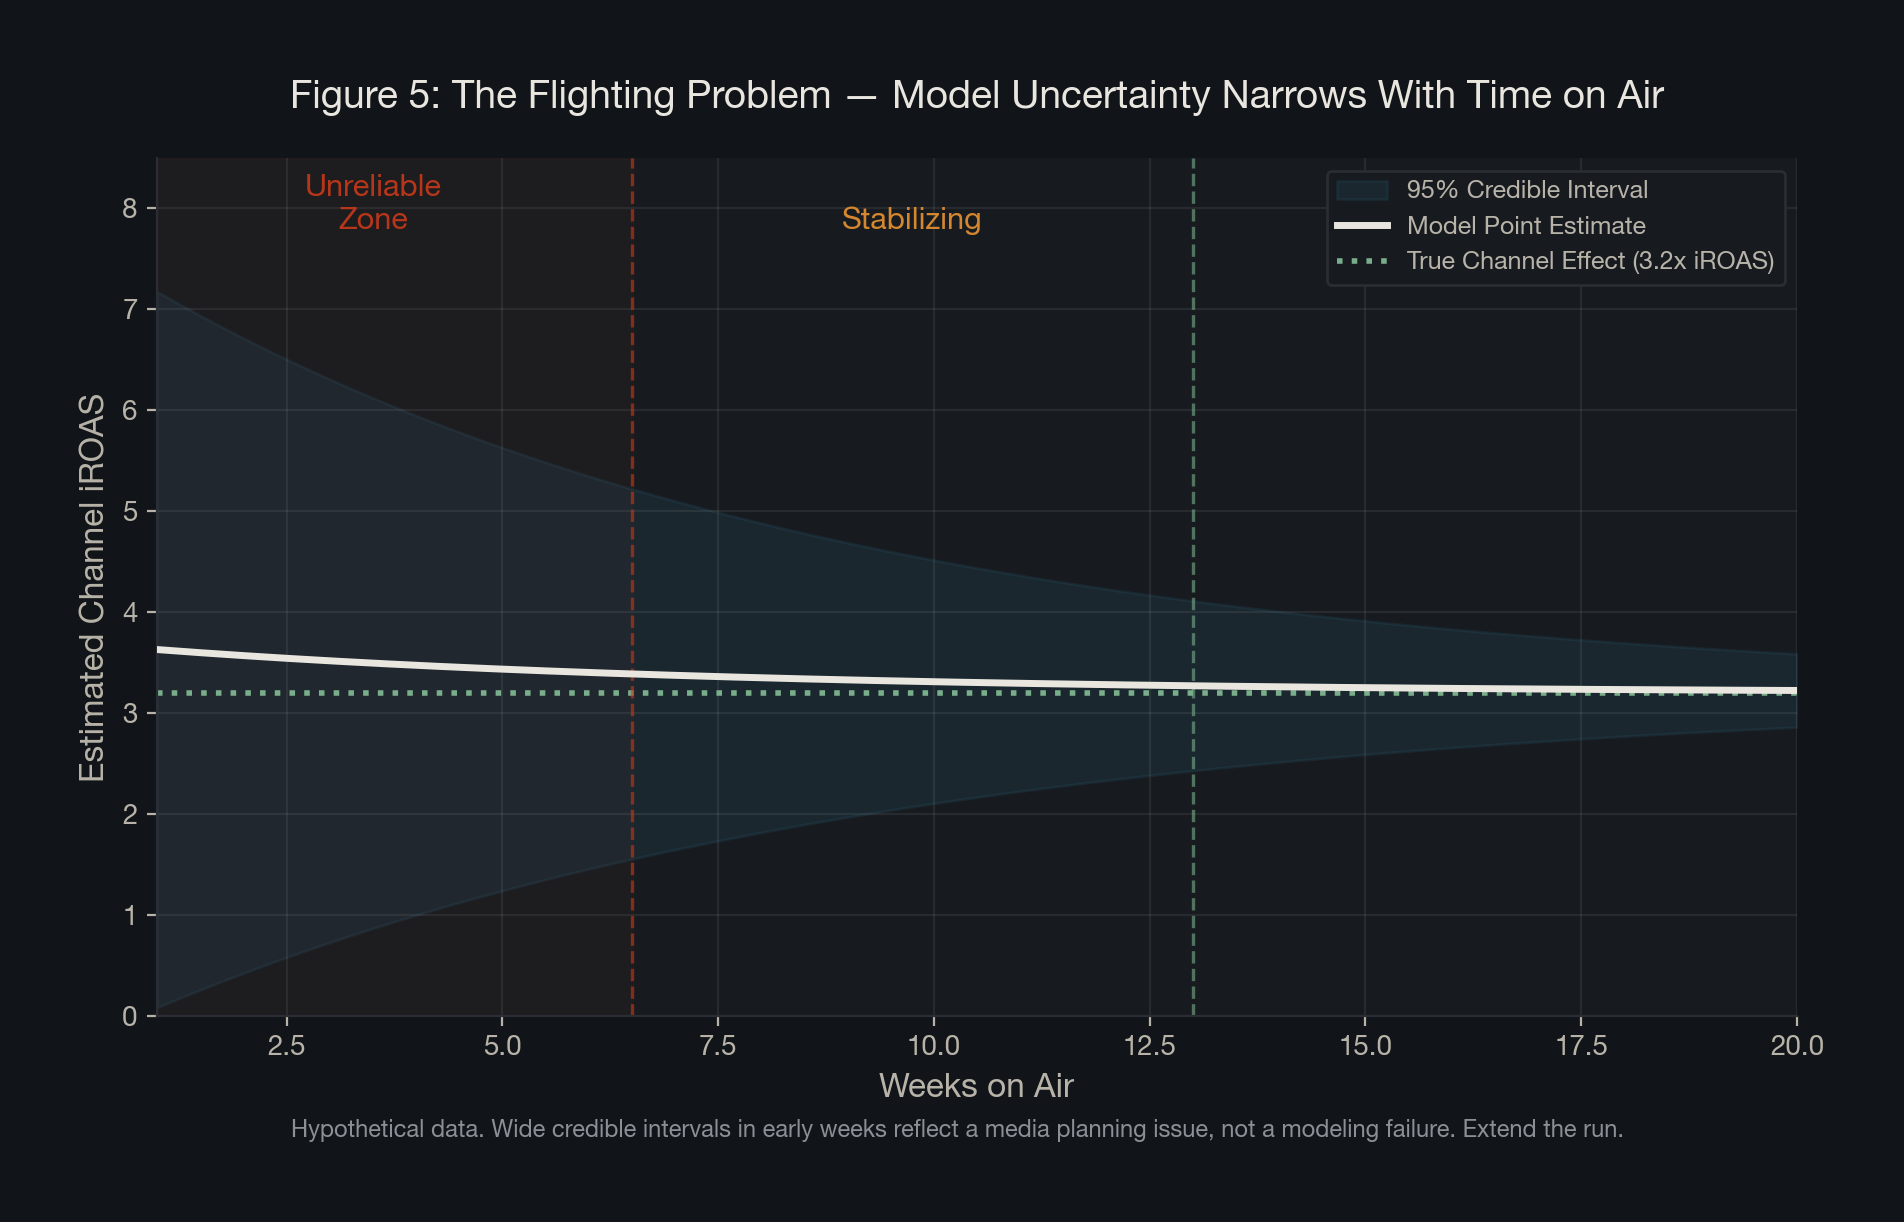
The flighting problem. When a channel has been on air for only a few weeks, the model has insufficient data to generate a reliable estimate. This is not a modeling failure; it is a media planning issue. The right answer is to fix the flighting strategy, extend the run, and return to the model with more signal before drawing conclusions.
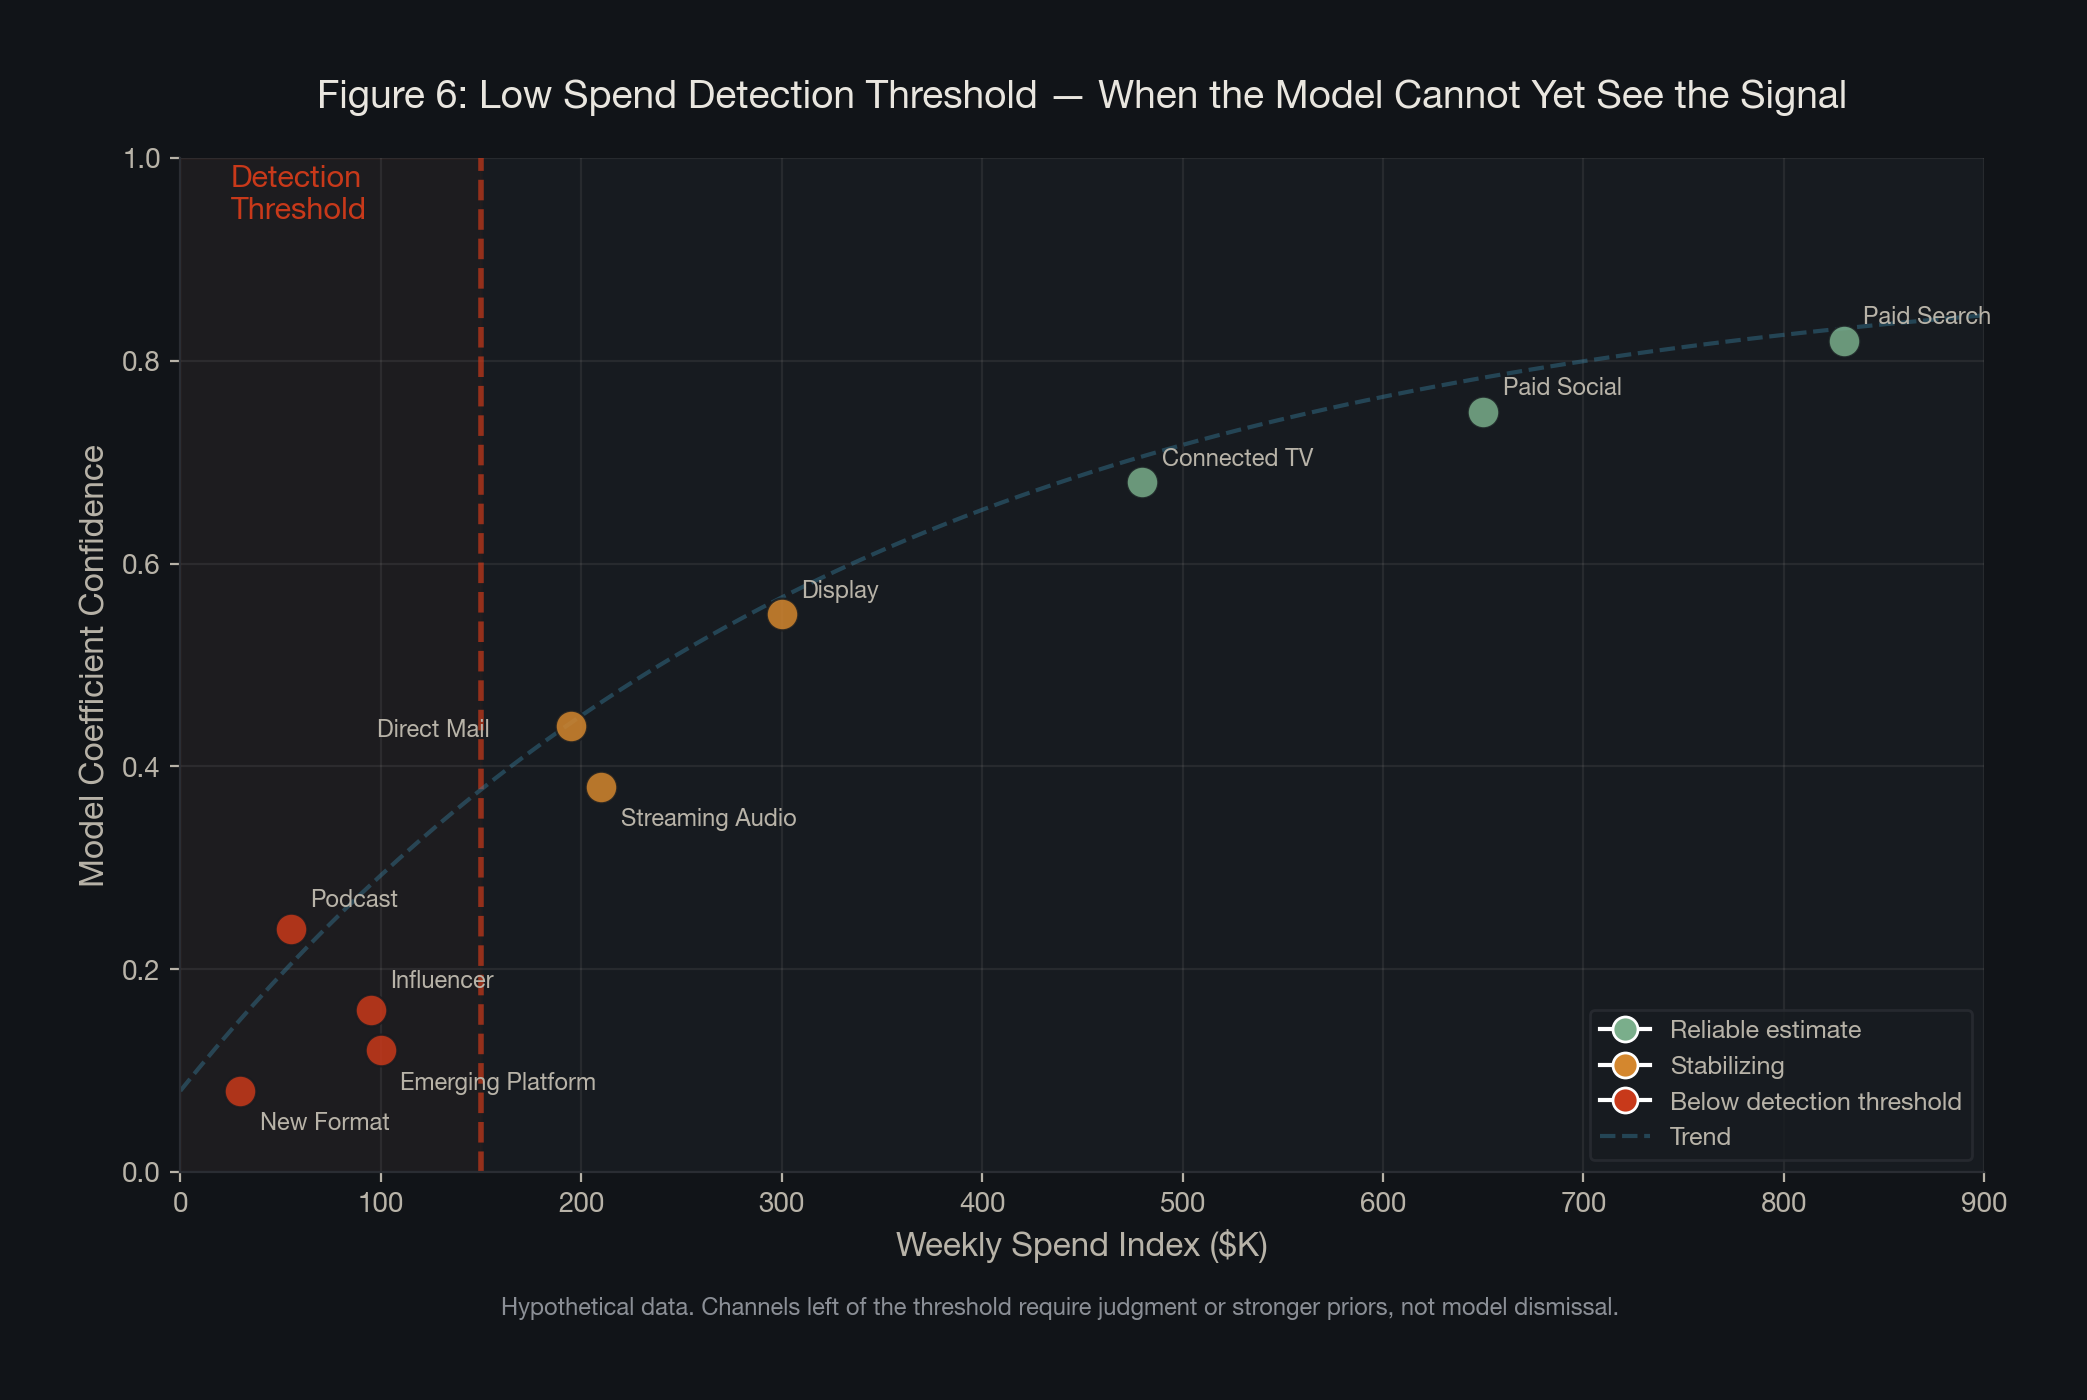
The low-spend detection problem. When investment in a channel is too small to register meaningfully in the data, the model will struggle to separate its effect from noise. The measurement leader's judgment is to set a minimum spend threshold before expecting the model to speak, or to use a weakly informative prior to hold a provisional position until the data matures.
The strategic platform bet. A new social platform, an emerging format, an experimental channel that leadership believes in but that the model cannot yet validate -- these investments require a learning agenda, clear expectations about how long it will take for the channel to generate enough data to speak, and patience for both the model and the consumer to catch up.
The person who understands not just what the model says but when to trust it, when to override it, and when the model is asking the wrong question entirely is the most strategically valuable person in the building.
Adstock: The Time Dimension of Advertising
Advertising does not work the way a light switch does: on when you spend, off when you stop. Its effects linger, accumulate, and decay at rates that vary significantly by channel, creative format, and purchase cycle. This is the phenomenon that Adstock was designed to capture.
The concept was first introduced by Simon Broadbent in 1979 and has since become a foundational component of every modern MMM.
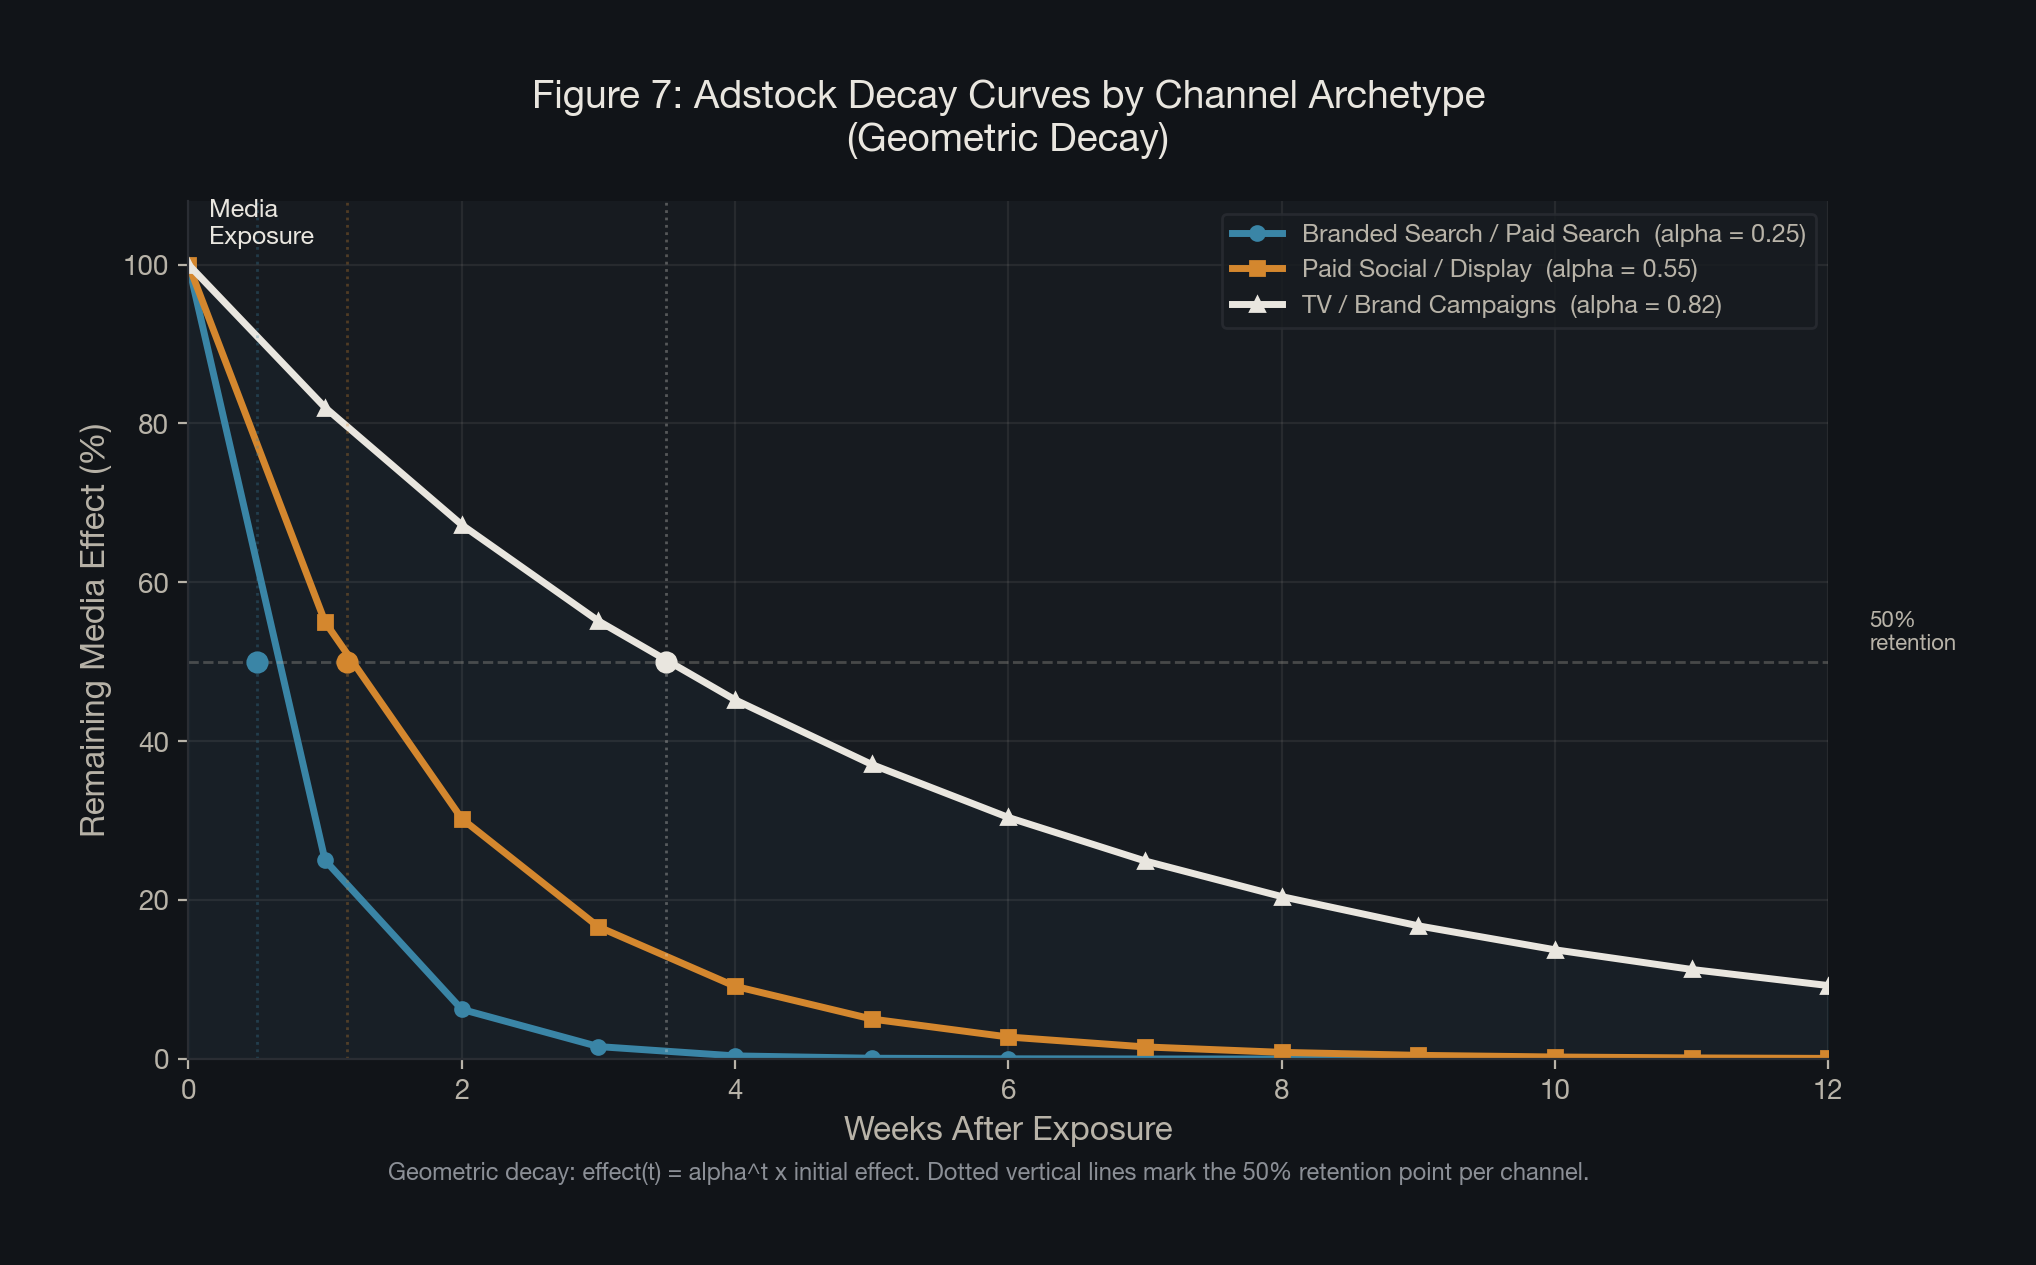
Alpha (0 < α < 1) is the decay parameter. Low alpha (0.2-0.3): fast decay, 1-2 week half-life. High alpha (0.8-0.9): slow decay, many weeks, typical for TV, OOH, and podcast.
In the Bayesian framework, the alpha parameter is not hardcoded. It is treated as an unknown parameter with its own prior distribution, and the model learns the most likely decay rate from the data.
This matters strategically as well as technically. A channel with a long adstock tail is contributing more to your business than a spend-by-spend view would suggest. Cutting it based on short-term platform ROAS metrics is a common and costly mistake.
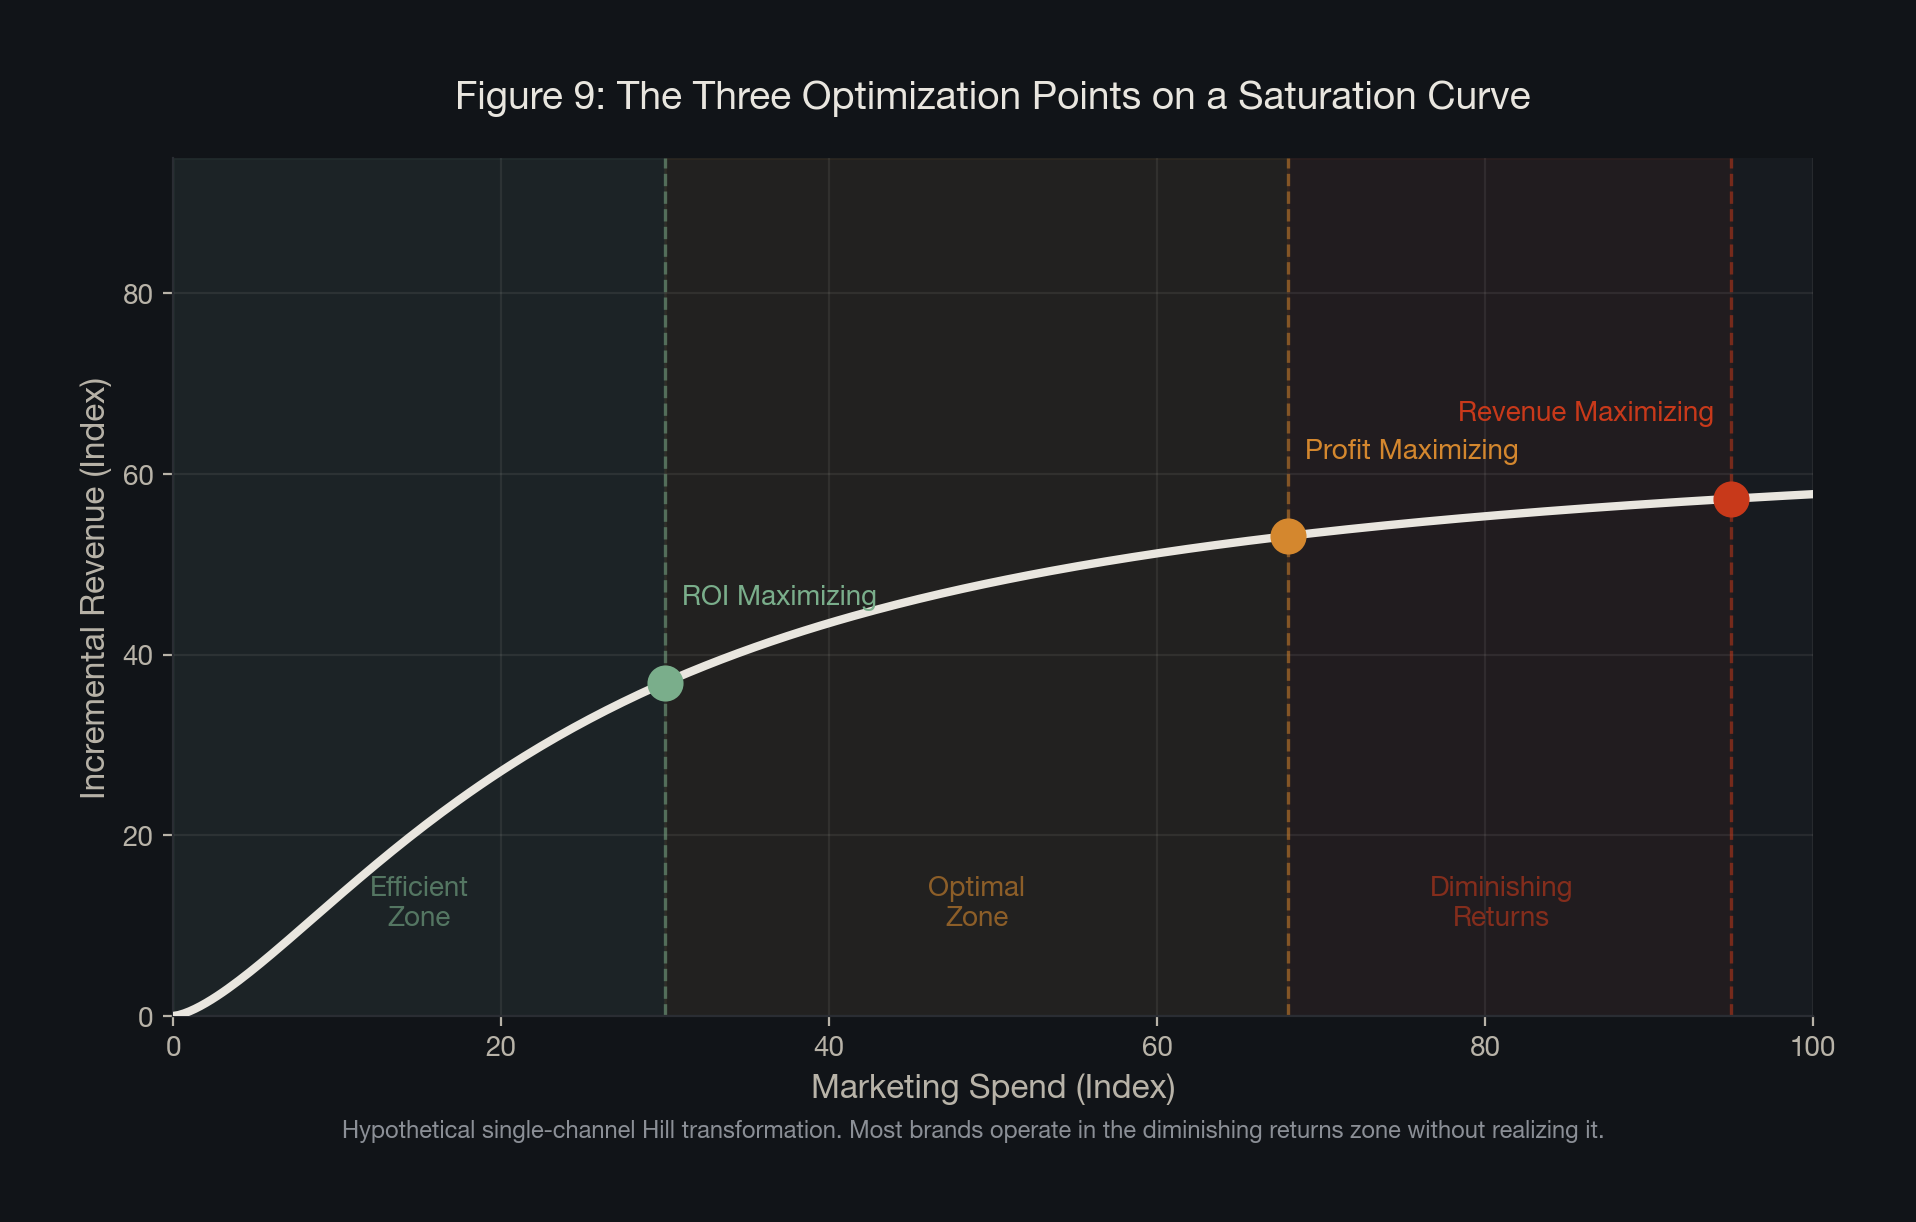
Diminishing Returns and Saturation
Every channel has a ceiling, and the question is where you currently sit on the curve.
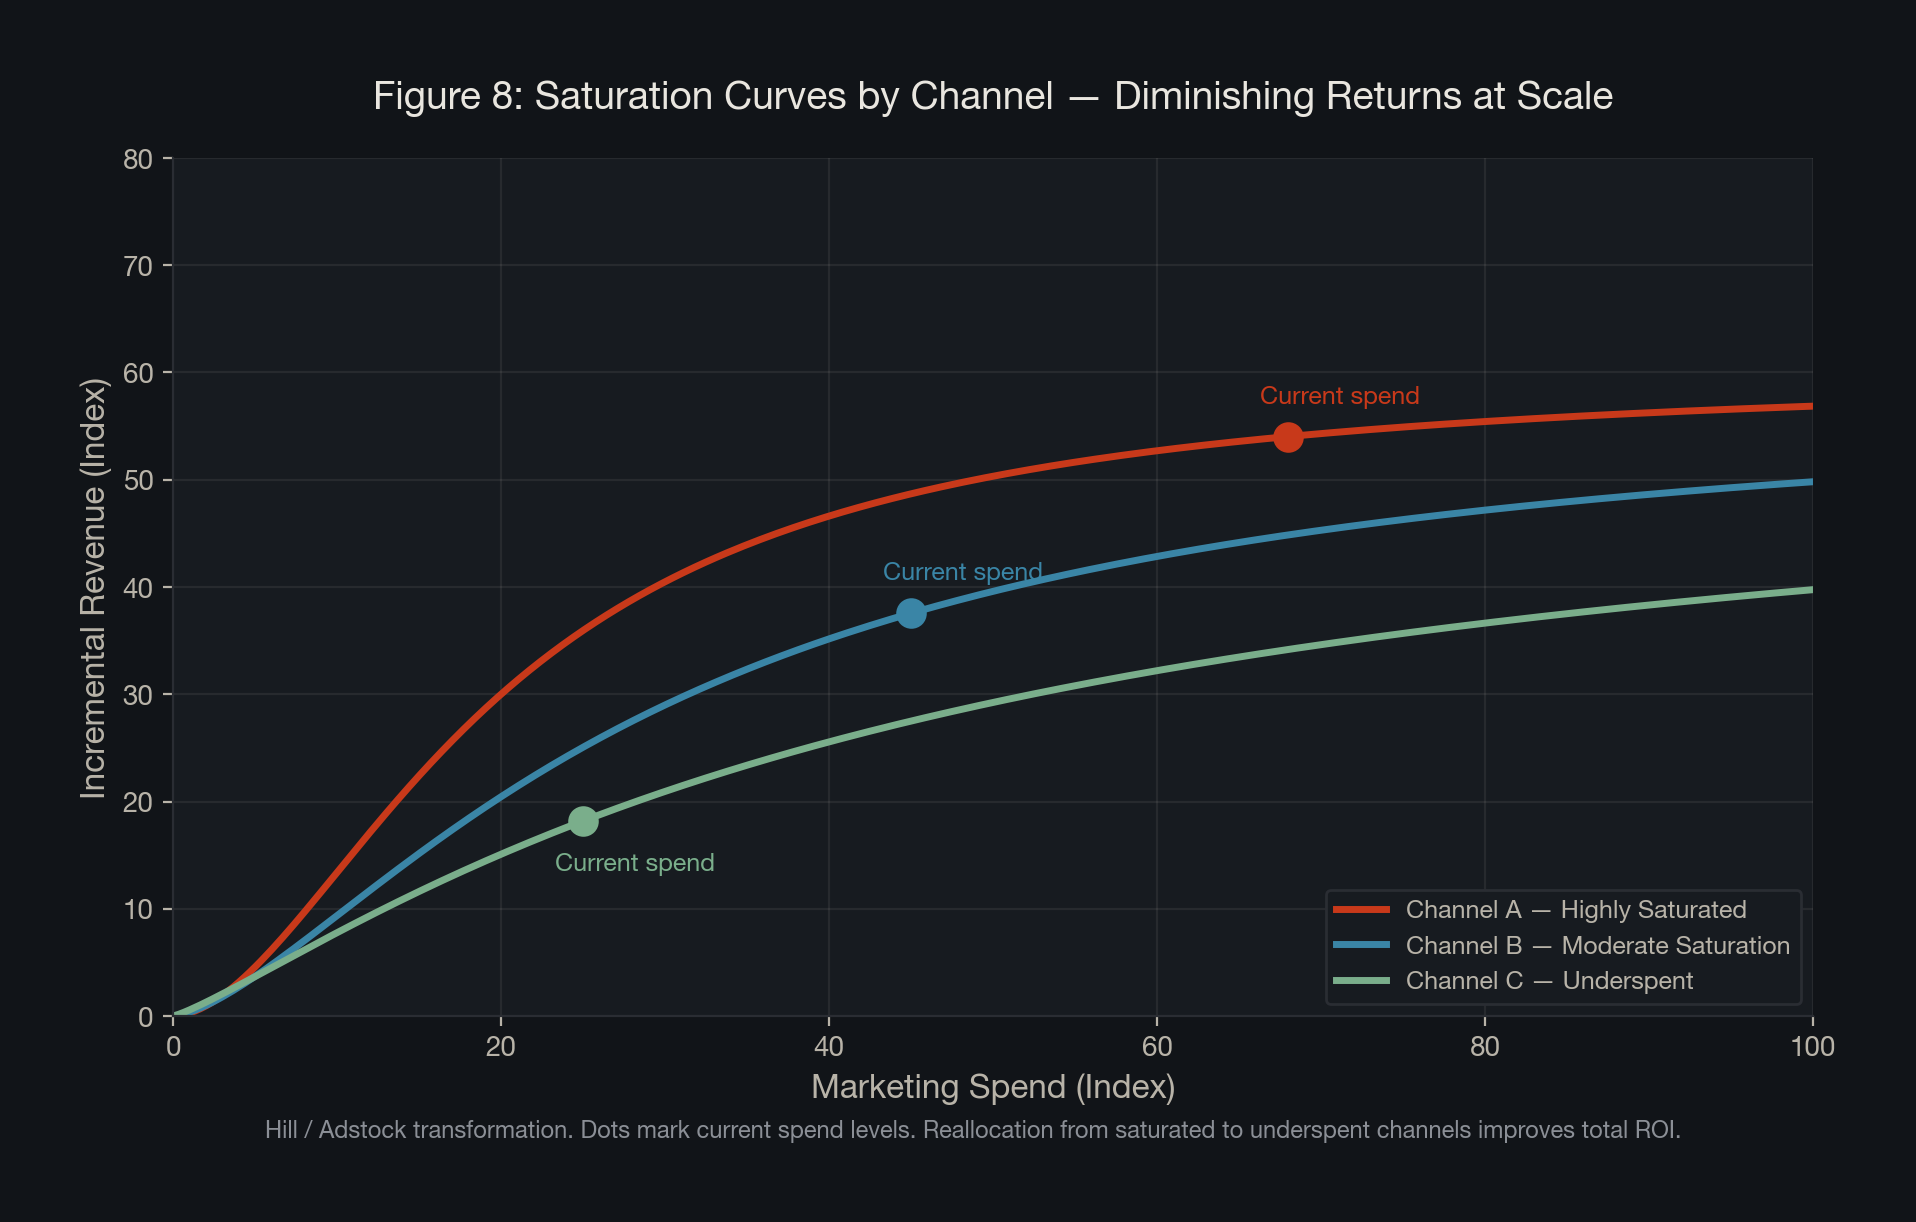
x = spend; β = maximum response; α = steepness of curve; γ = half-saturation point.
There are three optimization points every marketing leader should know: The ROI maximizing point (earliest on the curve), the profit maximizing point (marginal revenue = marginal cost), and the revenue maximizing point (near saturation).
Reallocation from channels operating near saturation to channels with room to grow improves total portfolio ROI without increasing total spend. This is perhaps the most powerful and underutilized insight that a well-calibrated Bayesian MMM produces.
From Model to Strategy: The MMM Lifecycle
All of the methodology we have covered converges into a single living system.
The initial model build is the most consequential moment. This is where the reference frame is set. Getting this build right is not about speed, it is about credibility.
Once the initial build is validated, the model enters a rerun cadence. New data is ingested, channel contributions are updated. Each rerun is not starting from scratch but updating prior beliefs with new evidence.
When the business changes meaningfully, a more deliberate refit is warranted. The measurement leader's judgment about when a rerun is sufficient and when a refit is necessary is one of the most consequential calls.
The fully calibrated model is also a forecasting and scenario planning engine. What is the projected revenue impact of shifting 15% of budget from branded search to connected TV? At what spend level does paid social hit its profit maximizing point? These are the questions that belong in a boardroom, and a well-built Bayesian MMM is the only system that can answer them.
The Strategic Payoff
Over the course of more than a decade in marketing measurement, I have seen the transformation that happens when organizations move from correlation-based measurement to causal frameworks. Budget reallocations that felt risky become defensible, channels that looked essential turn out to be largely redundant.
The numbers matter, of course, but the deeper shift is cultural. When marketing teams trust their measurement, they make bolder, better-calibrated decisions. When finance teams trust the methodology, they engage as partners rather than skeptics.
When your measurement tells you what actually works -- not just what correlates -- it changes the entire conversation around the table.
This matters more now than it ever has. AI is accelerating every part of the modeling process. What AI cannot do is exercise judgment about when the model is asking the wrong question.
AI can run the model. It cannot decide when the model is wrong. That judgment is the measurement leader's edge.
Incrementality and causal inference are not niche methodological concerns for data scientists. They are the foundation of every trustworthy answer to the question every marketing leader is ultimately responsible for: did our marketing actually work?
References
- Holland, P.W. (1986). Statistics and Causal Inference. JASA, Vol. 81, No. 396.
- Pearl, J. (2009). Causality: Models, Reasoning, and Inference. Cambridge University Press.
- Shao, X., Li, L. (2011). Data-driven multi-touch attribution models. ACM SIGKDD.
- Brodersen, K.H. et al. (2015). Inferring causal impact using Bayesian structural time-series models.
- Jin, Y. et al. (2017). Bayesian Methods for Media Mix Modeling. Google Research.
- Google Meridian (2025). Open-source Bayesian MMM framework.
- PyMC Labs (2021). Bayesian Media Mix Modeling for Marketing Optimization.
- Meta Robyn (2024/2025).
- Stella (2025). 2025 DTC Digital Advertising Incrementality Benchmarks.
- Stella (2025). Incrementality Study: How Incremental is Meta Really?
- ANA (2024). Survey on incrementality as KPI.
- Chan, D., Perry, M. (2017). Challenges and Opportunities in Media Mix Modeling. Google Research.
- Broadbent, S. (1979). Adstock concept.
- Moussavi, H. (2026). Can AI Build a Trustworthy MMM? Ovative Group.